Clockwork’s dashboard gadget lets you configure your Jira dashboards to track worklogs data.
This feature is only available in Clockwork Pro.
Adding Gadgets to your Jira Dashboard
To add one of the Clockwork gadgets to your Jira dashboard:
-
Navigate to the Dashboard in the left nav bar and select the dashboard you want to edit.
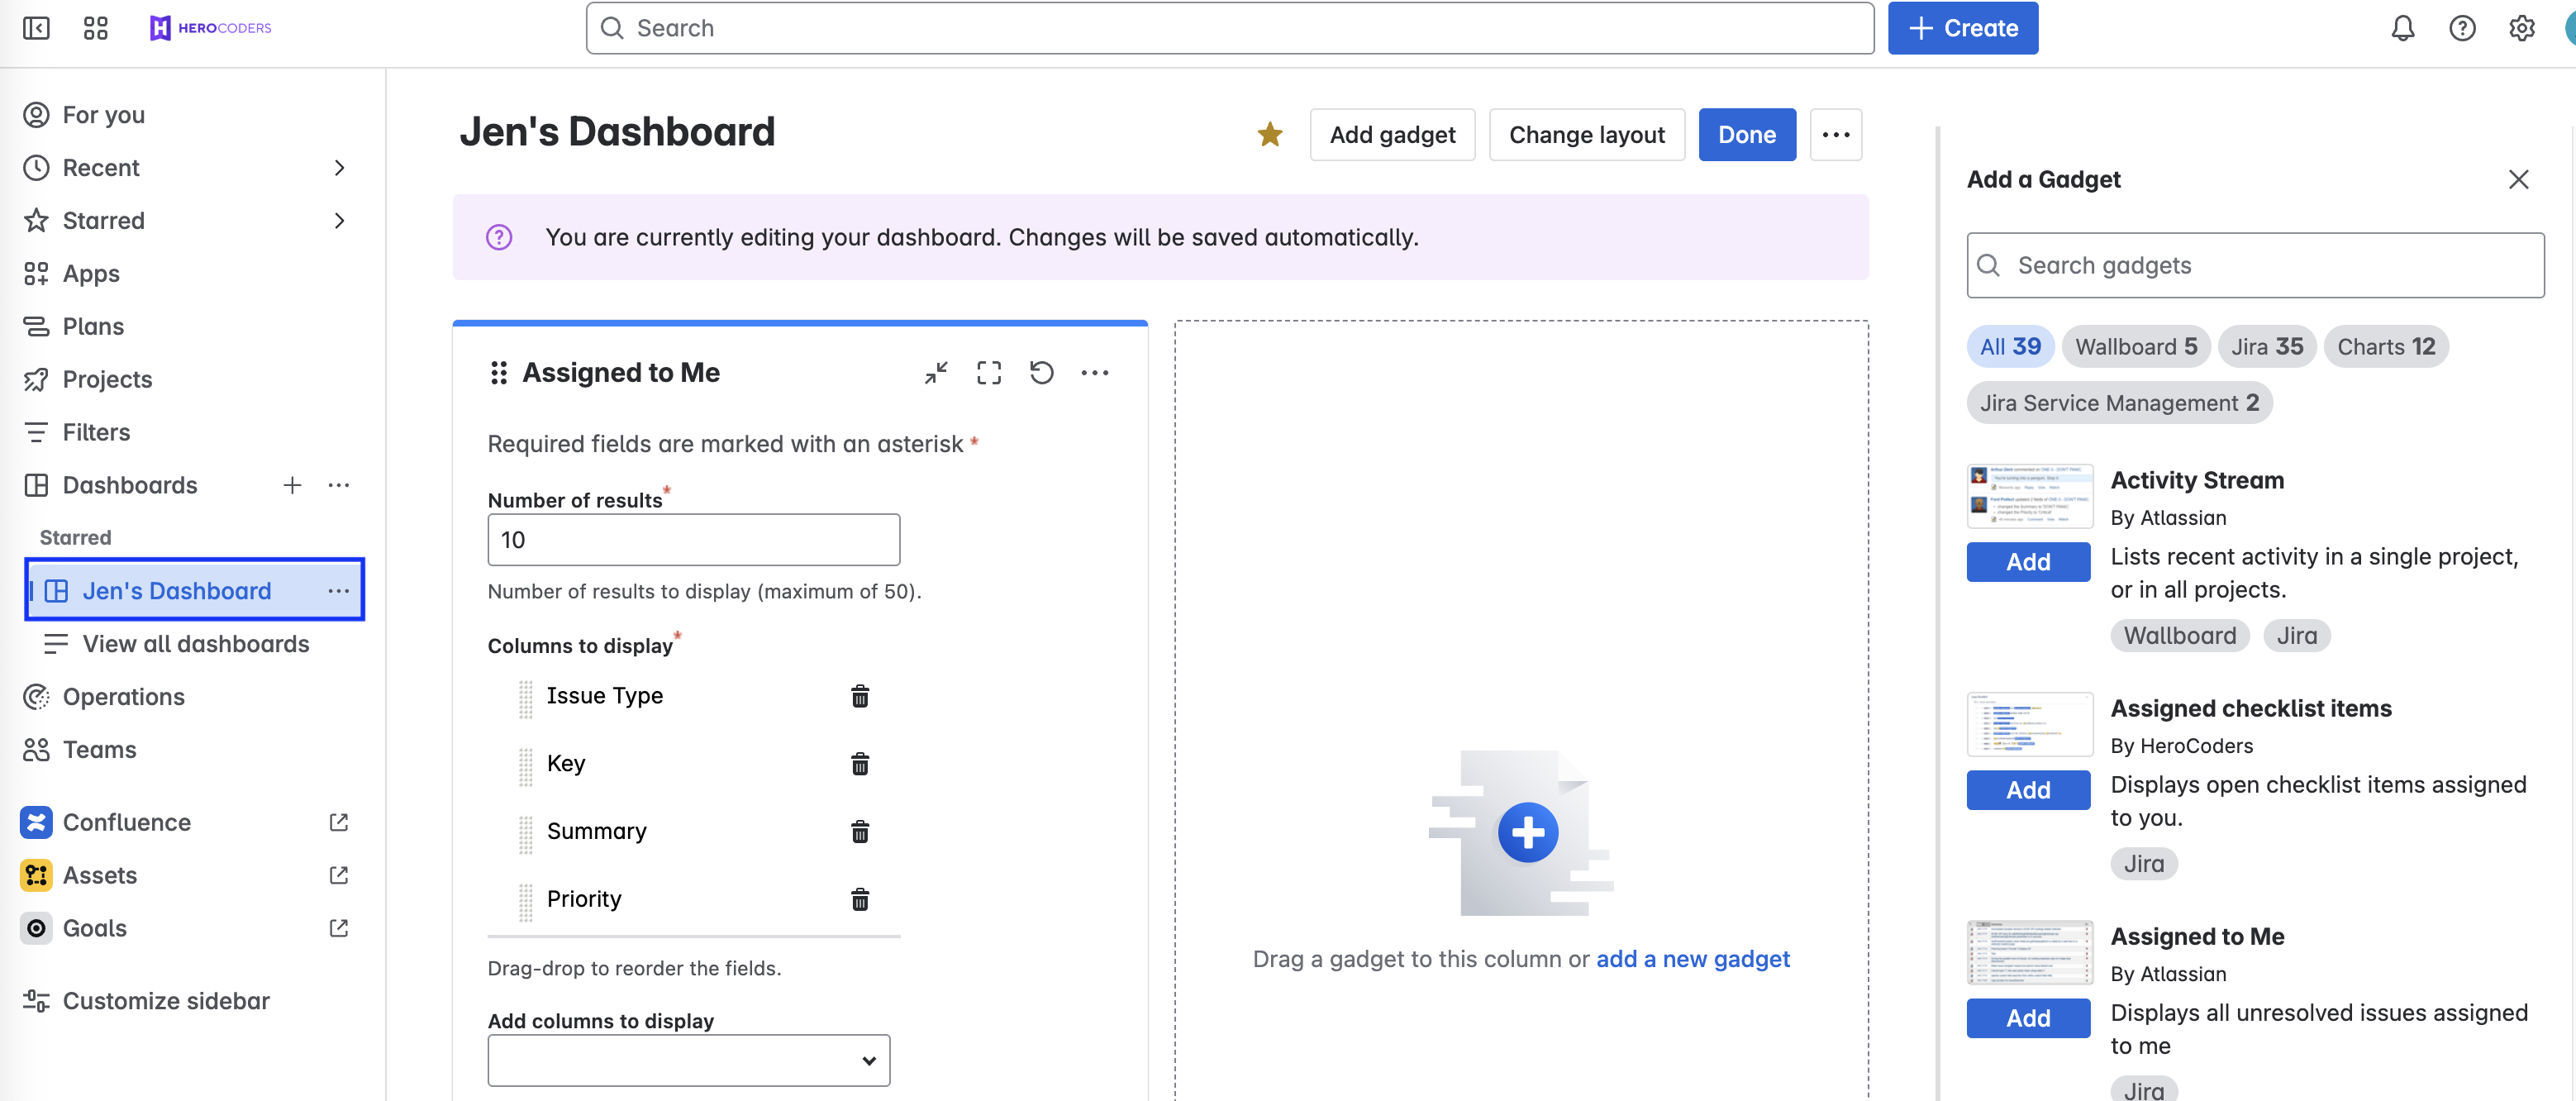
Jira Dashboards -
Type “Clockwork” in the Add a Gadget search bar.
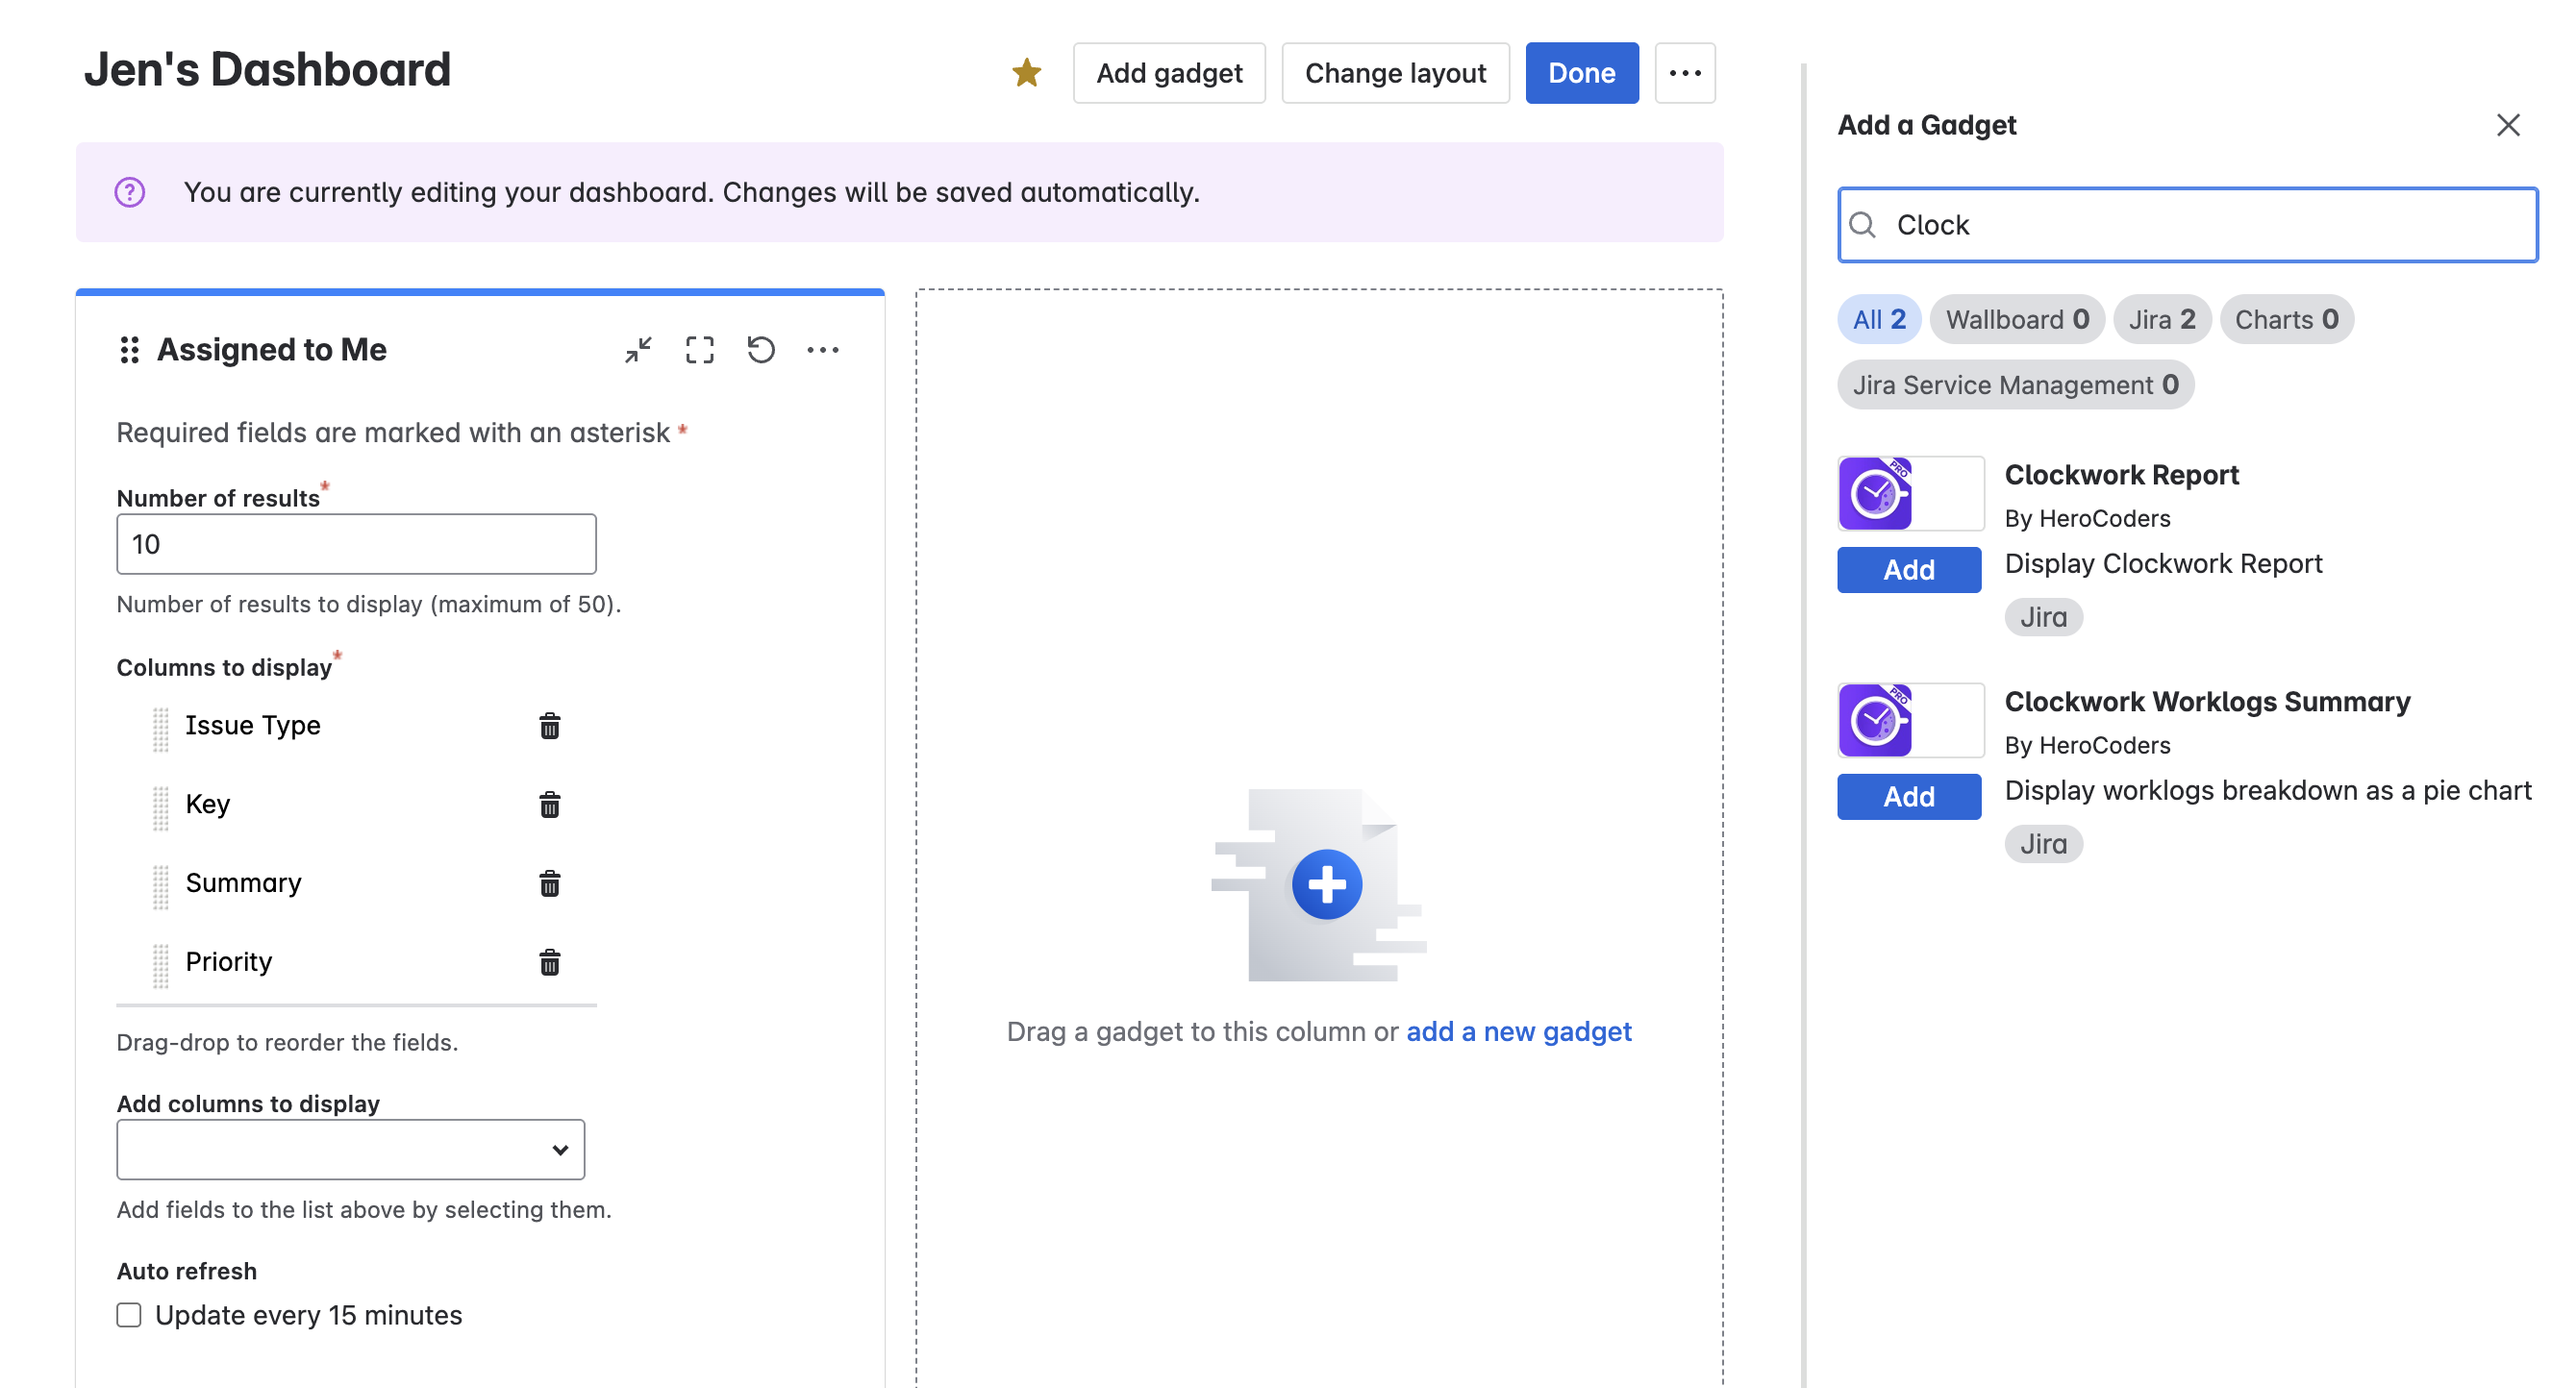
Clockwork Dashboard Gadgets -
Click Add for the gadget you want to include on your Jira dashboard.
To move the gadget to a different position on the dashboard, find the dots in the upper left corner of the gadget and drag them to where you want the gadget to appear.
Clockwork Worklogs Summary
The Clockwork Worklogs Summary gadget shows the time spent split between selected breakdown. You can configure it with the time range and breakdown you want to see on the spot.
View time spent grouped by:
-
Spaces / s
-
Epics
-
Work item types
-
Labels
-
Worklog attributes
-
Custom fields
You can also filter the data presented in the gadget to certain spaces.
Clockwork Report
Add your favorite Clockwork reports to your Jira Dashboard to see the data at a glance!