
Epics Map and Report for Jira
See your Jira project plan and issue hierarchy at a glance. Visualize your roadmap as a Graph, Tree Map or Pie Chart. Click on an Epic, in any view, to drill down to individual issues in the hierarchy. No complex configuration required. Just install and use.
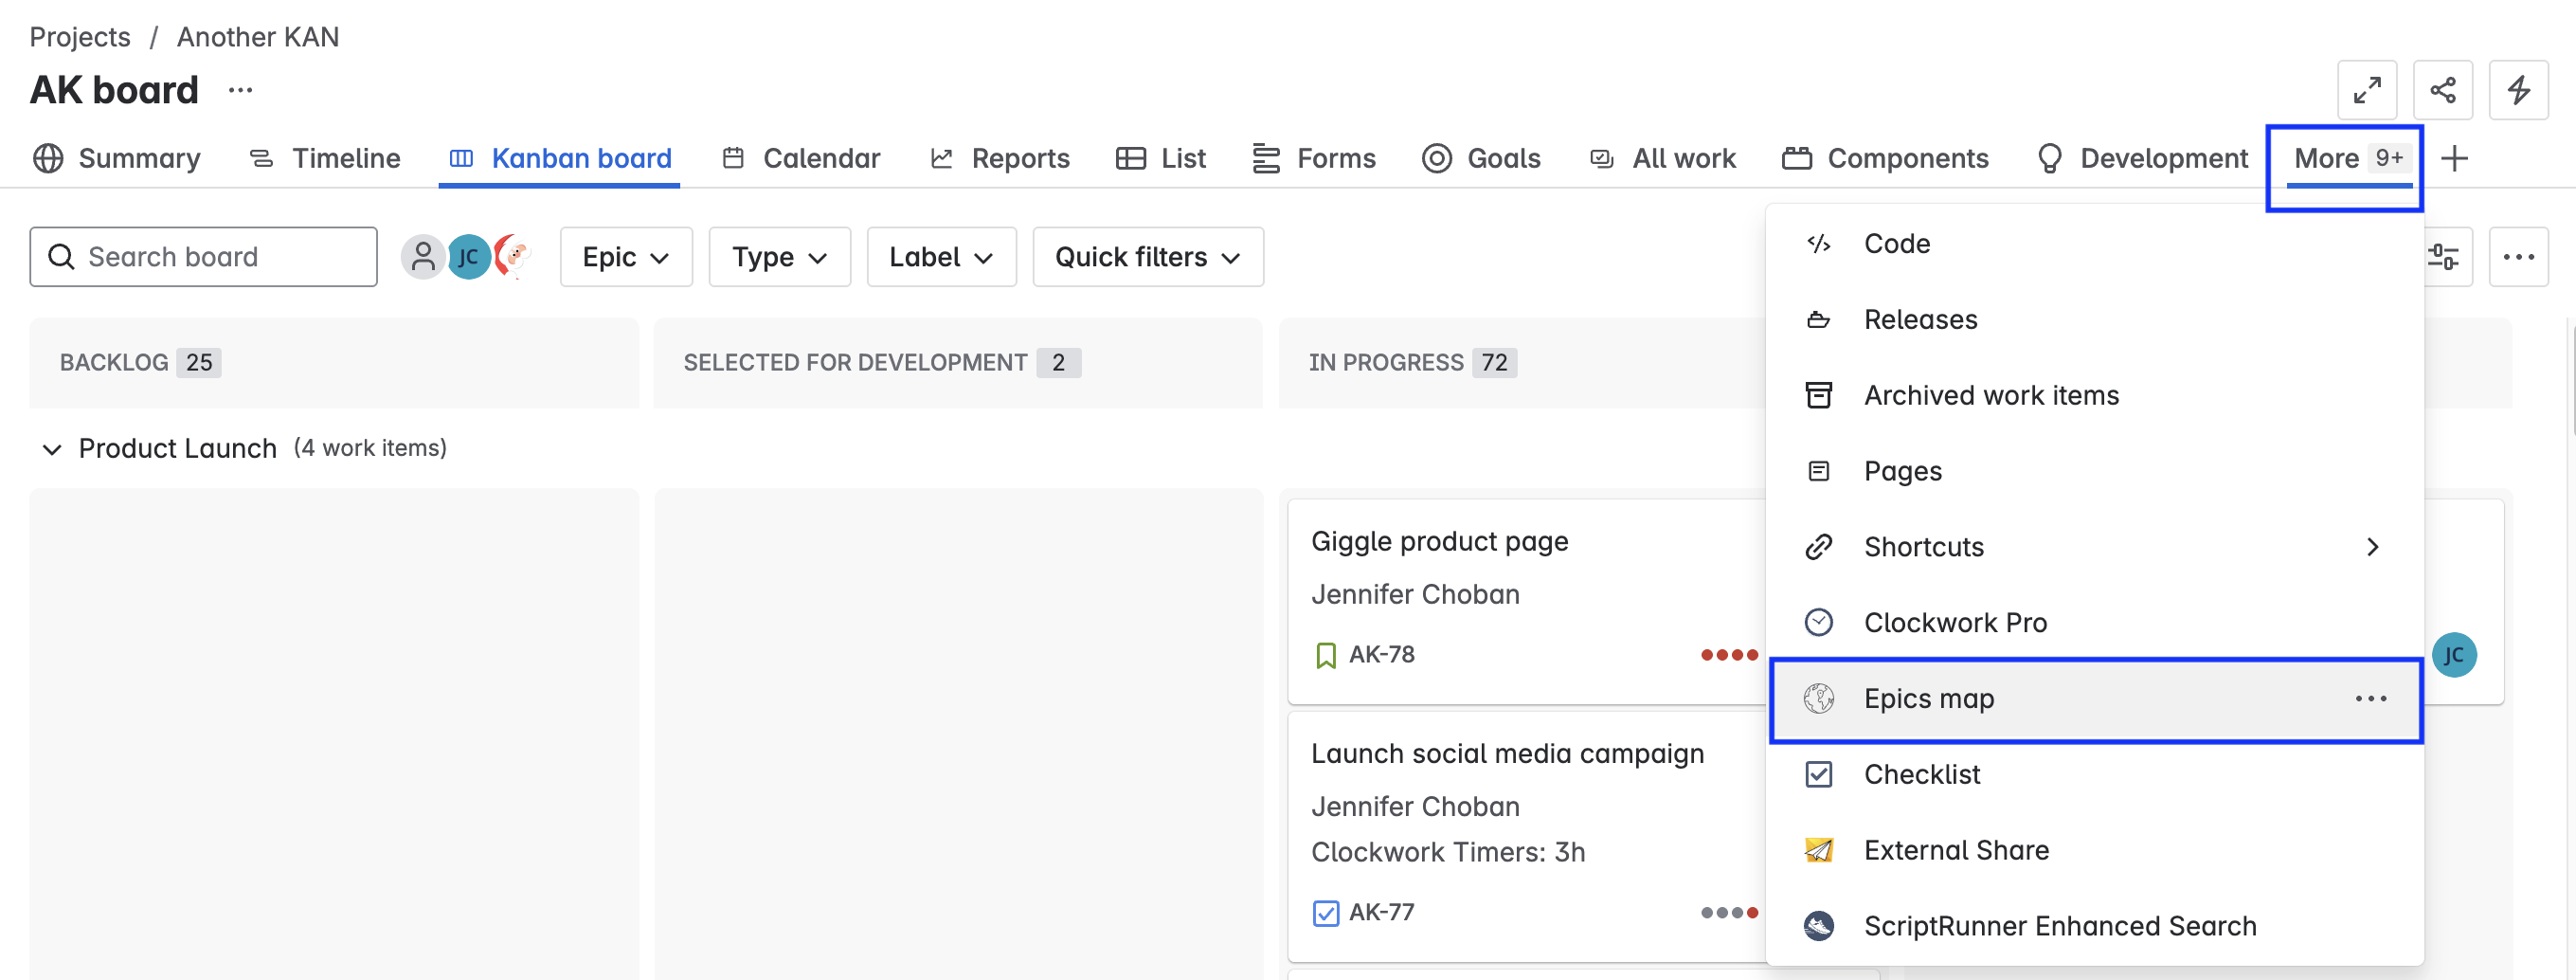
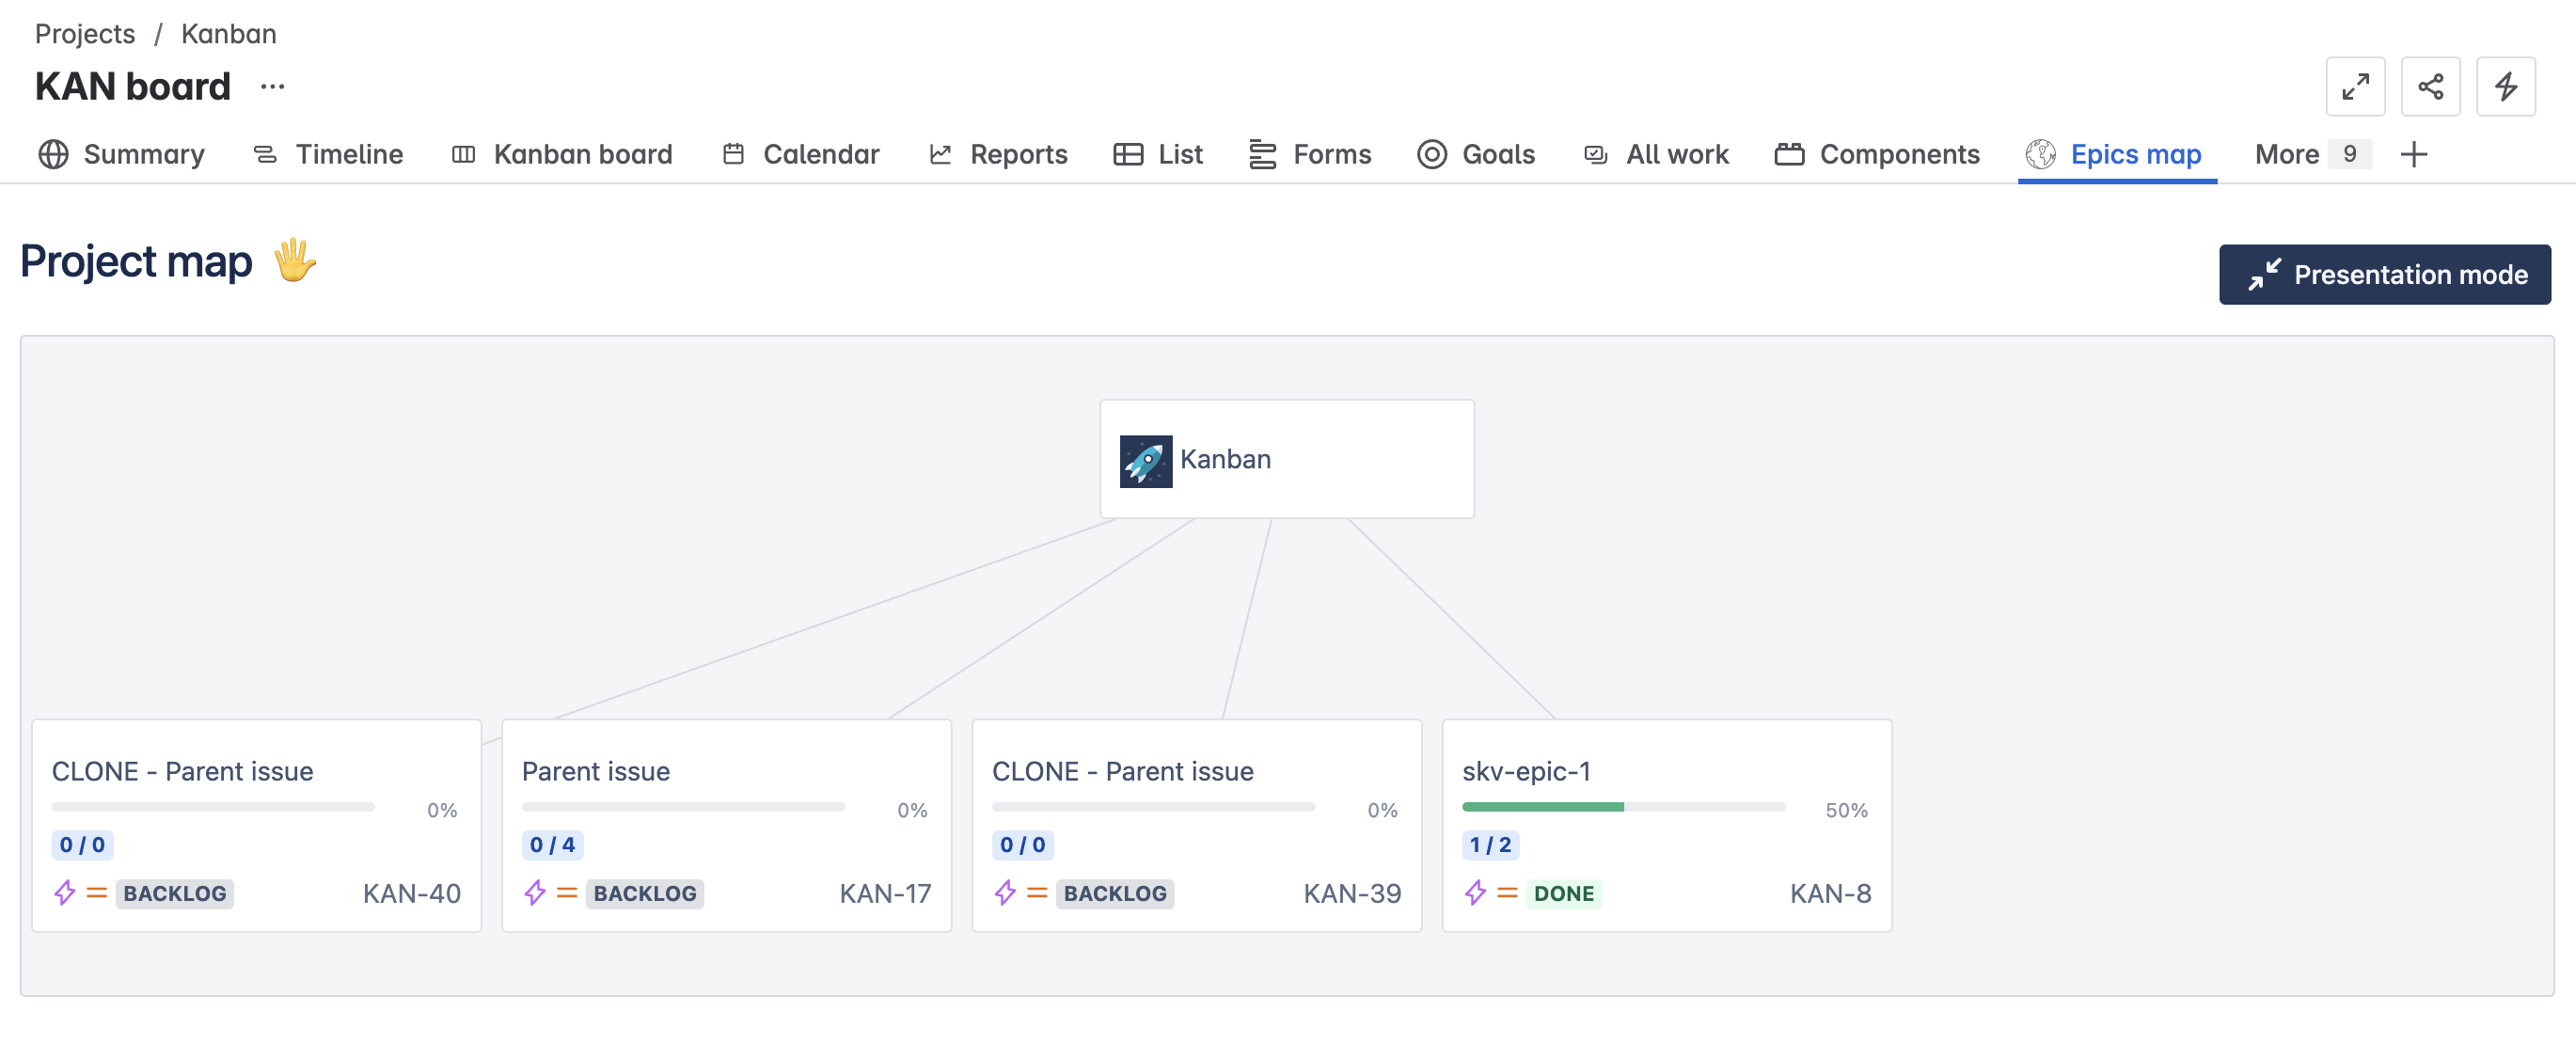
Open Epics Map
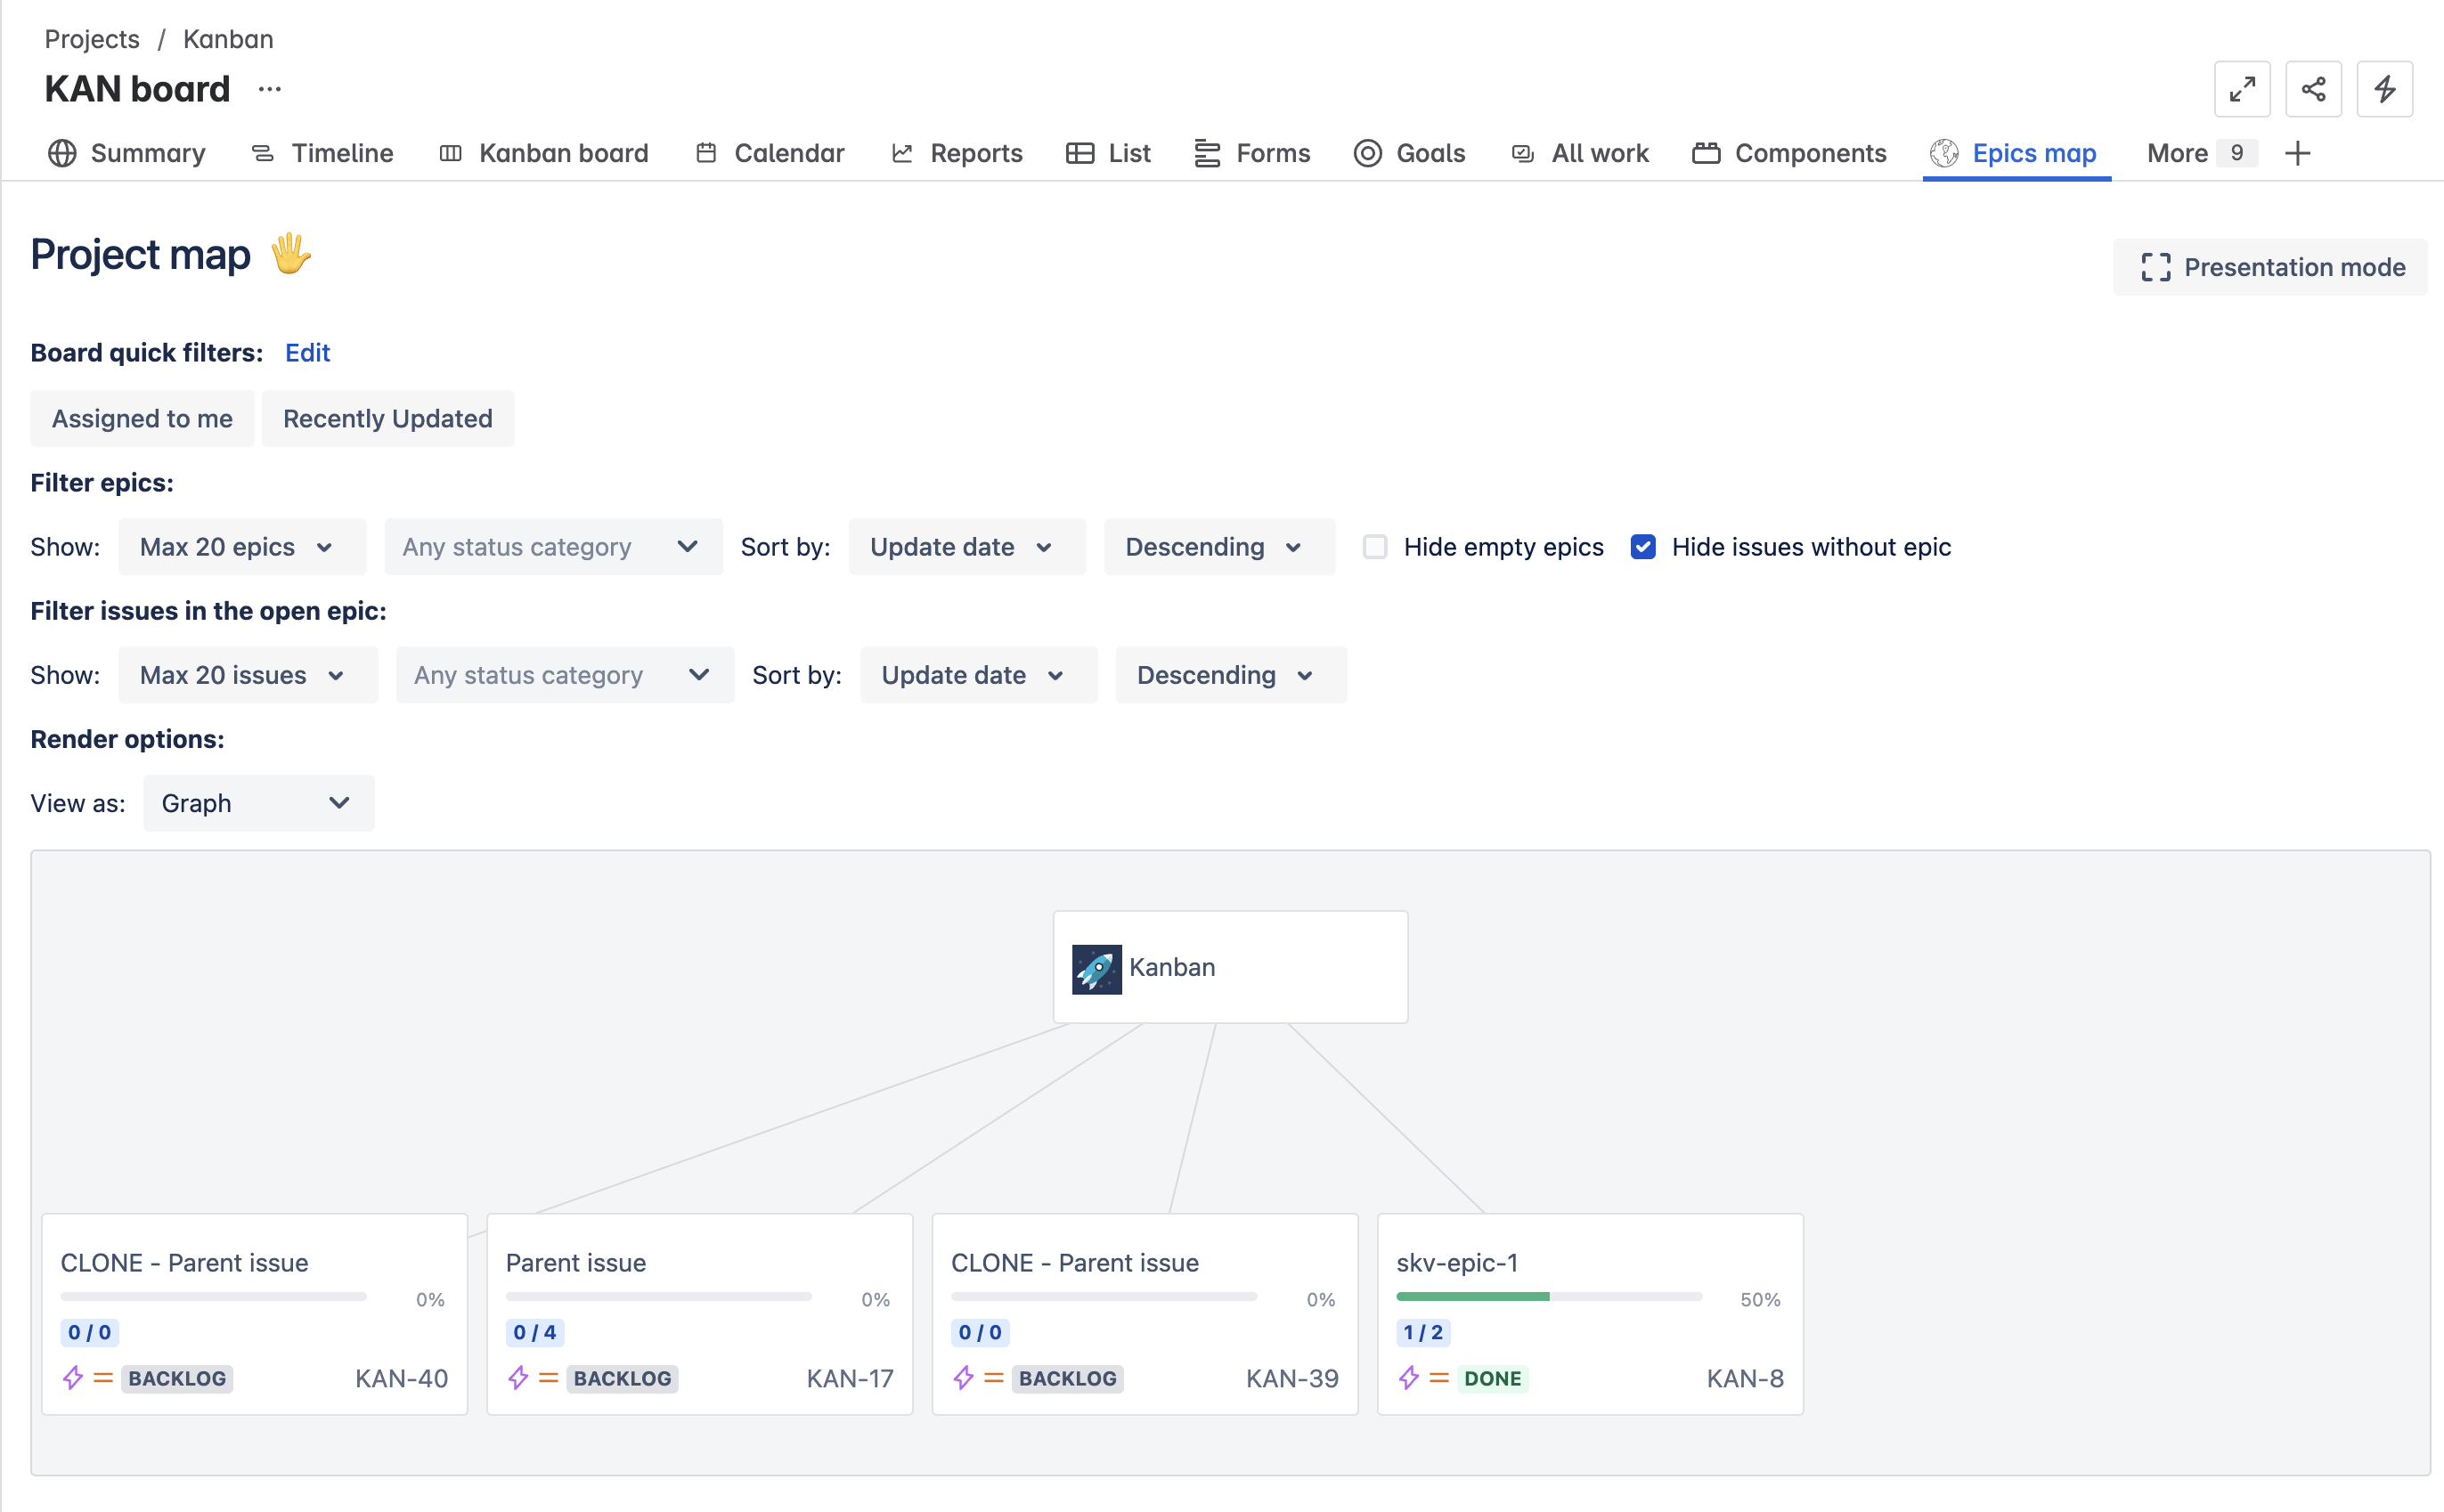
To open Epics Map navigate to the More… menu, the select Epics map.
Features
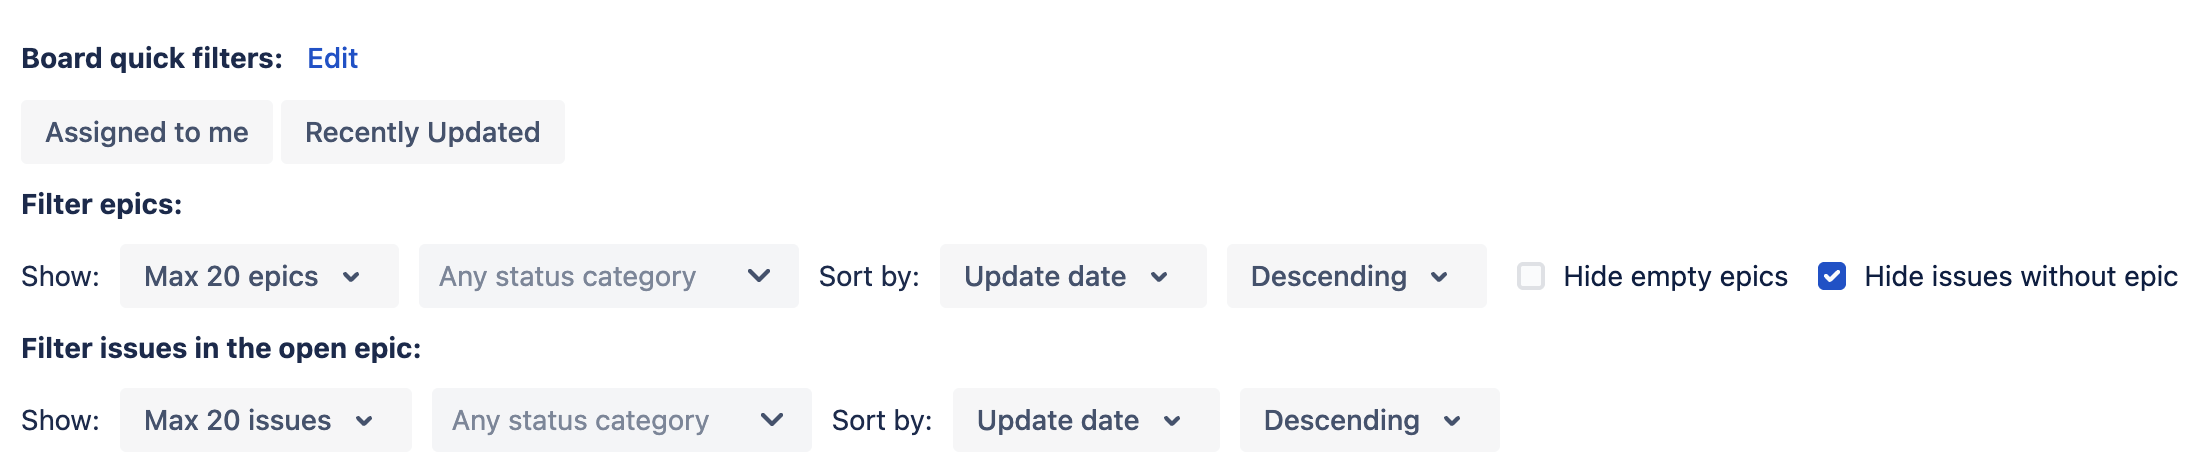
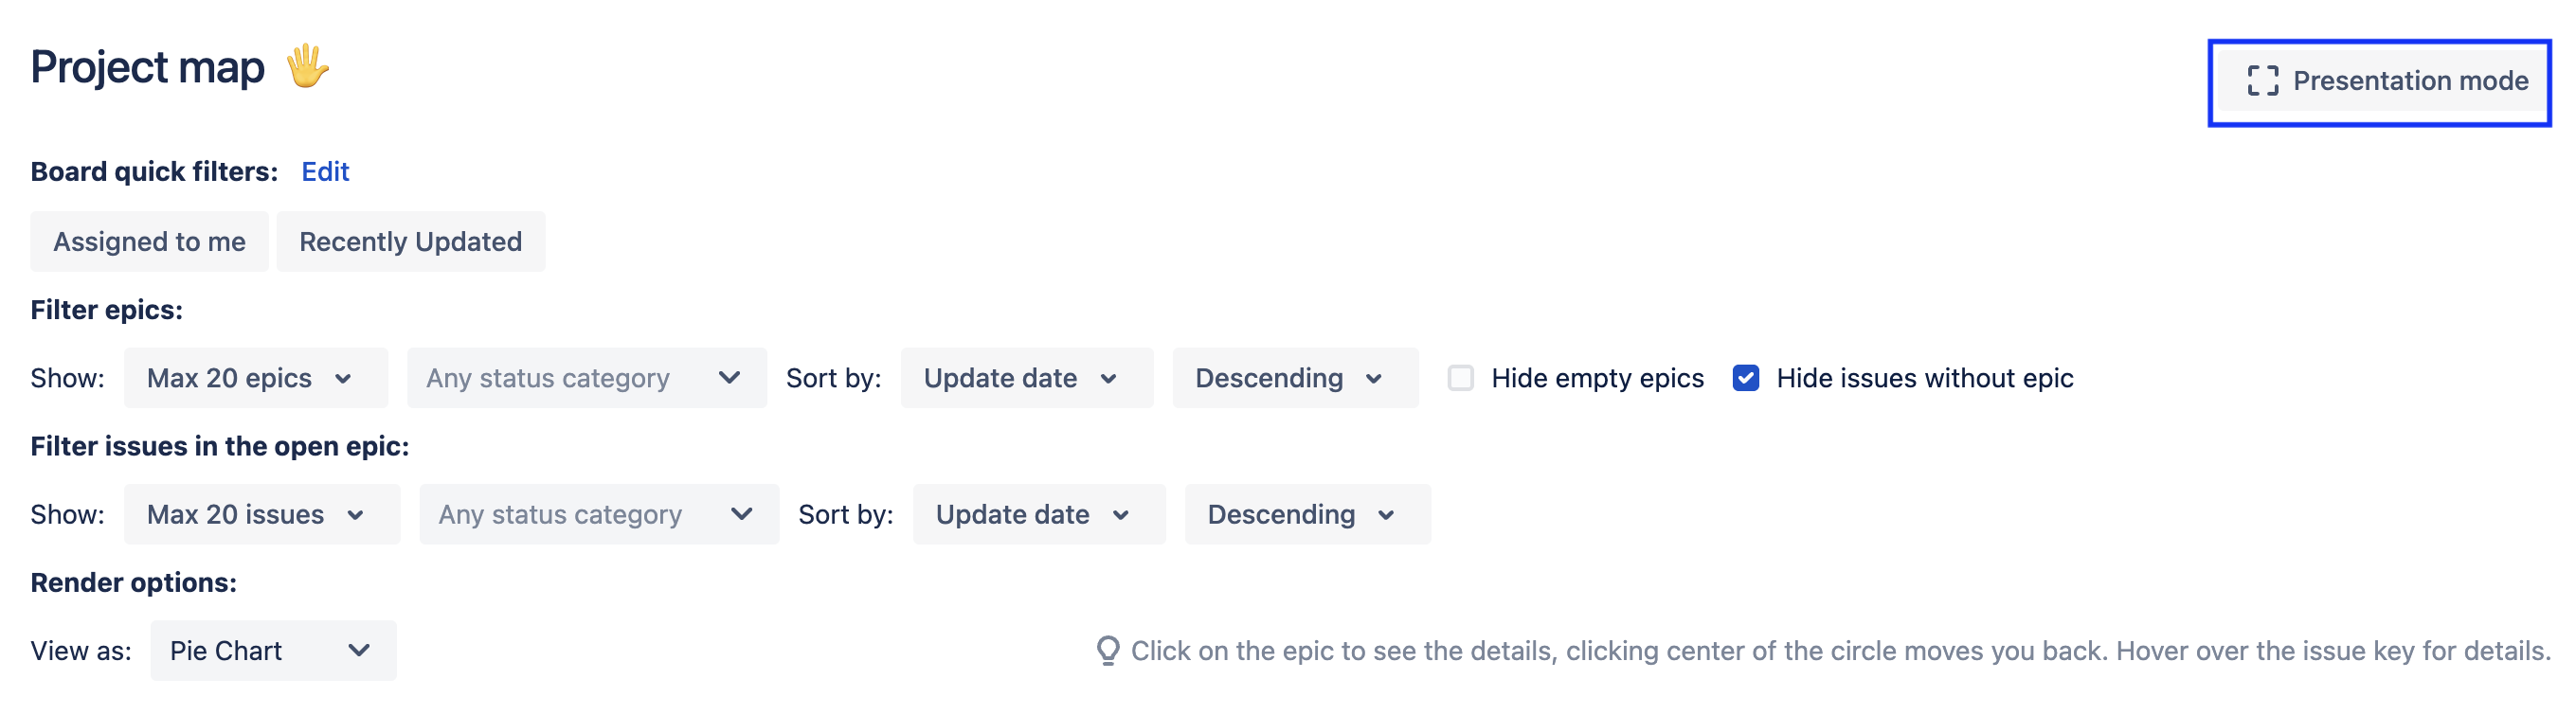
Filter / Sort Options
Epics Map copies the Quick filters that are configured on your project board. You can also use the dropdowns to filter by the status category (To Do, In Progress, Done).
You can sort Epics and issues by:
Creation date
Due date
Priority
Start date
Summary
Updated date
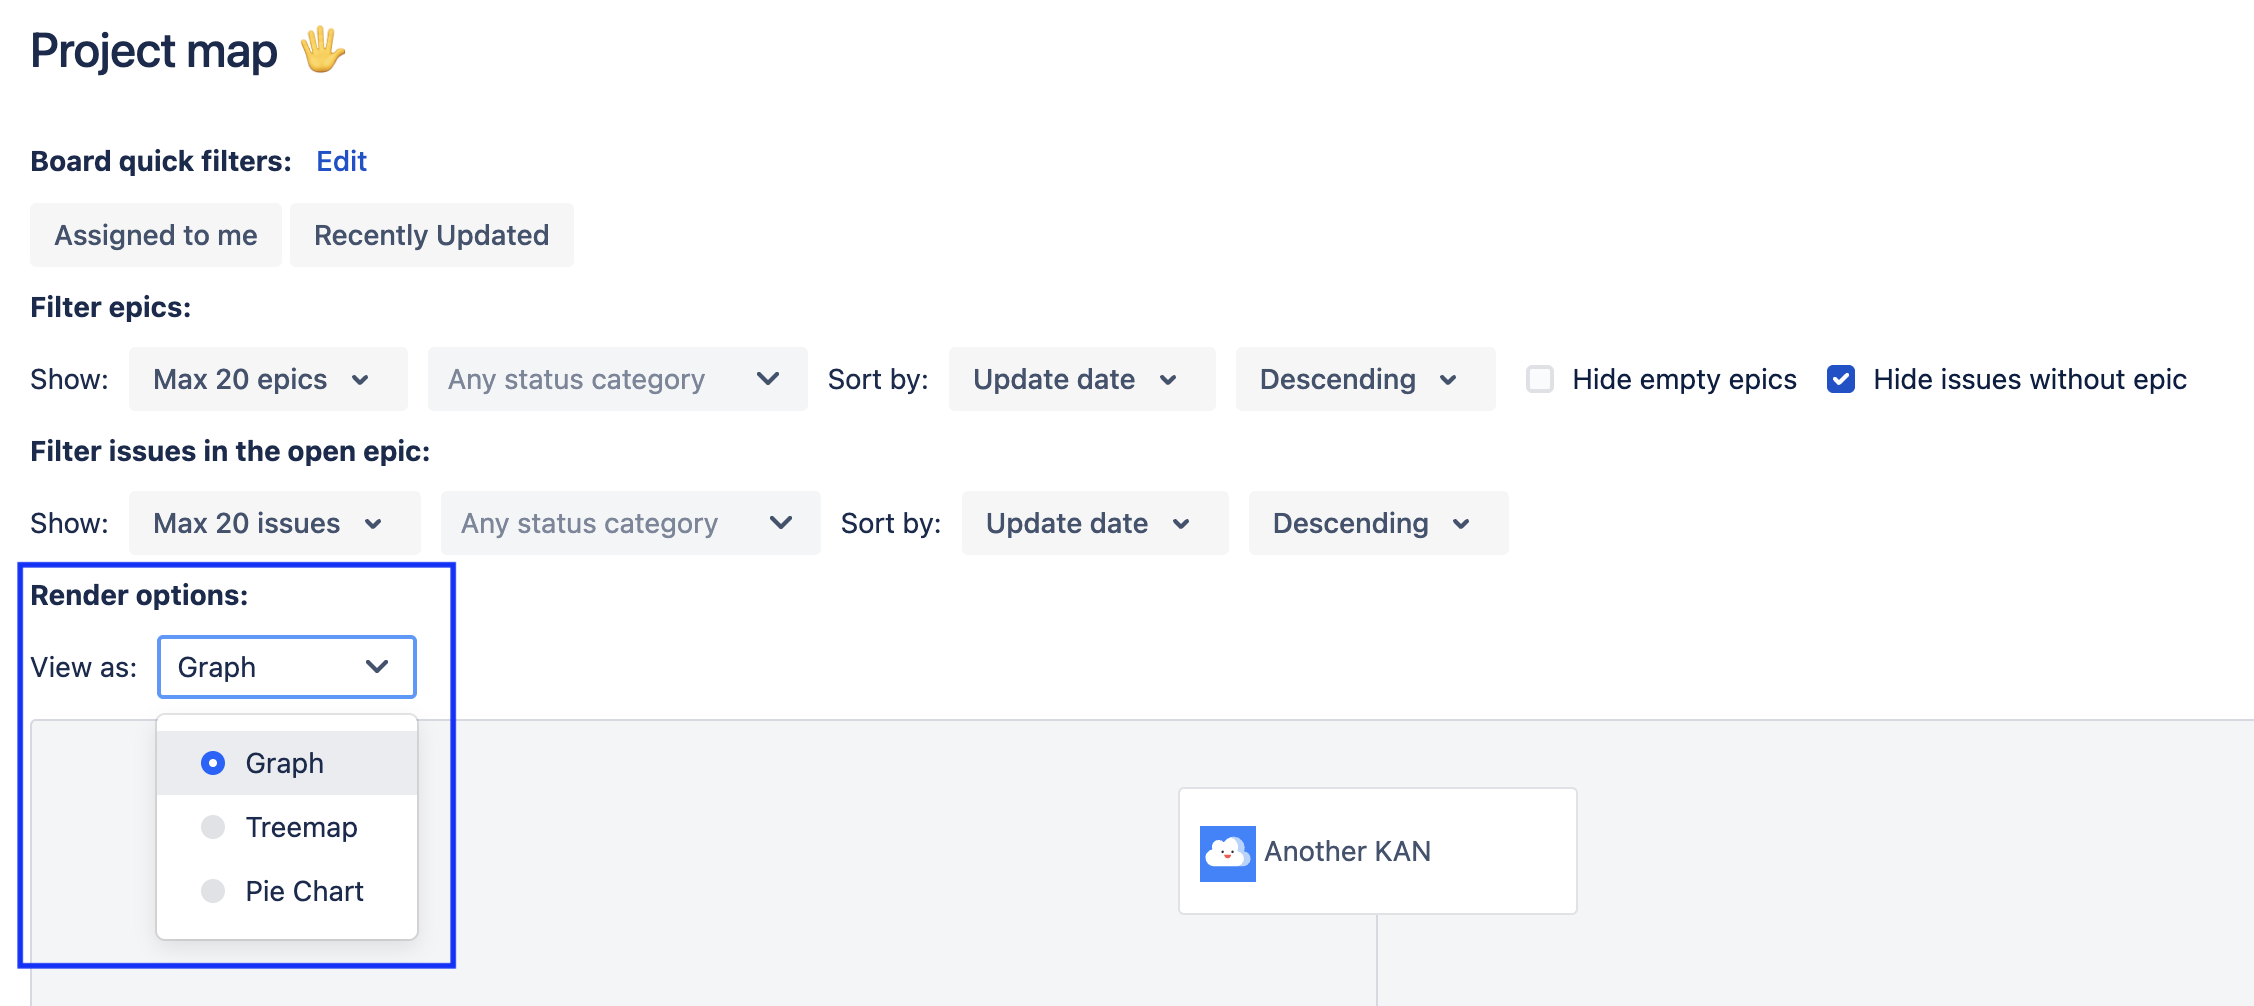
Views
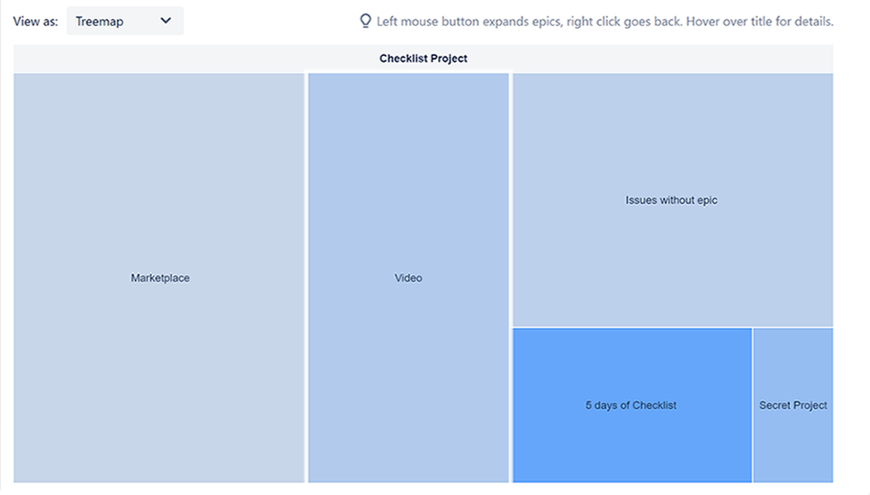
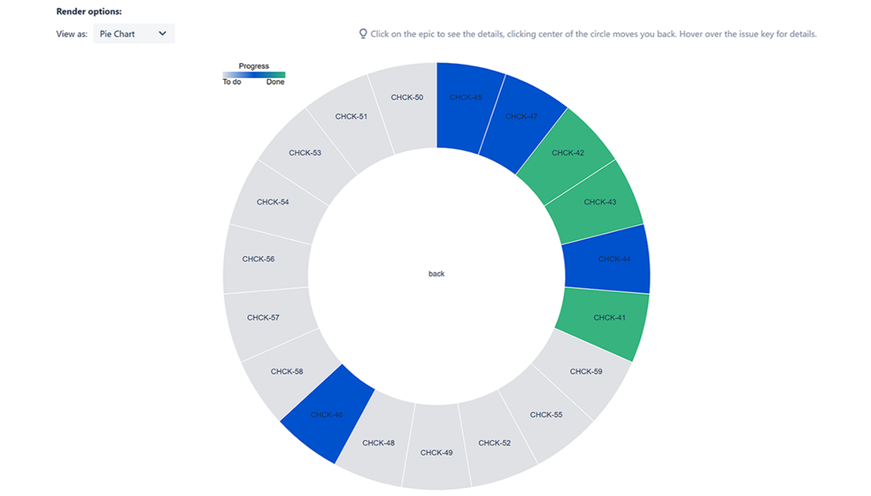
Epics Map provides multiple ways to visualize your project hierarchy in multiple ways. View progress and reports, or add an issue from the Graph view. Color-coded tree maps highlight risk. Pie charts show the proportional size of each epic.
In each view, you can click on the Epic to show its child issues.
To change how the Epic(s) are rendered, click on the View as dropdown and select the appropriate View.
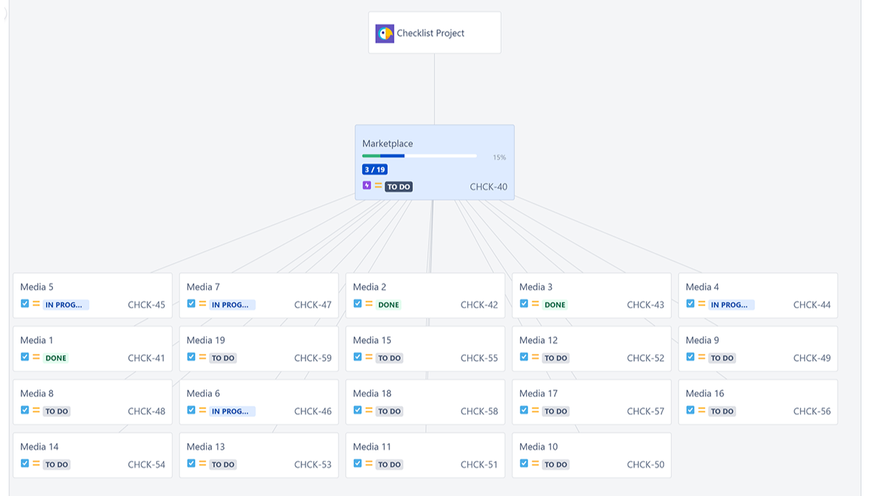
Graph
Tree Map
Pie Chart
Presentation Mode
Epics Map allow you to quickly convert any View into an image appropriate for a presentation by hiding the filters.
To hide the filters, click on the Presentation mode button.
Graph View – Normal Mode
Graph View – Presentation Mode
Drill Down to Jira Issues
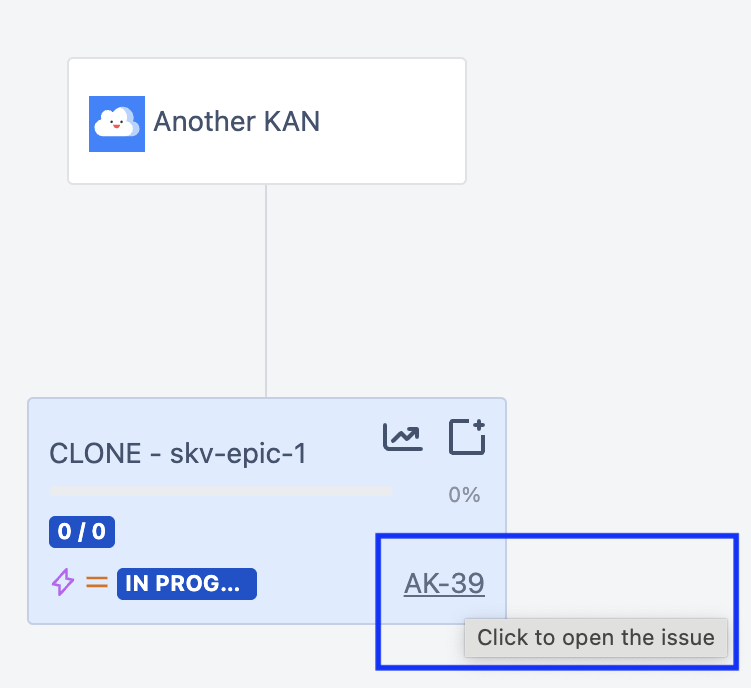
You navigate to a Jira issue from the Epics Map UI.
To navigate to an issue:
Select Graph in the Render options dropdown.
Click on the Issue key link for the Epic or issue.
Create New Jira Work Items
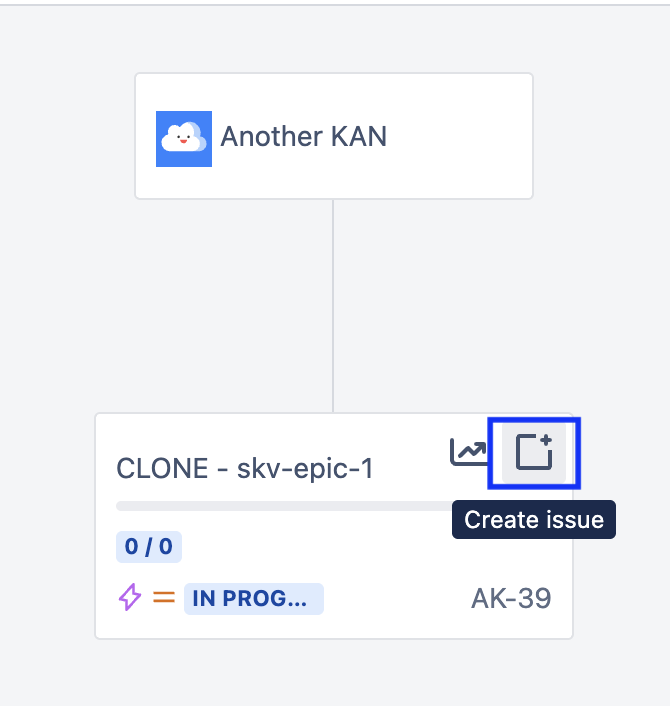
You can create new issues from the Graph view:
To create a new Jira issue:
Hover over the Epic in Graph view.
Click on the Create issue icon.
Complete the fields in the screen and click Create.
Jump to Jira Epic Report
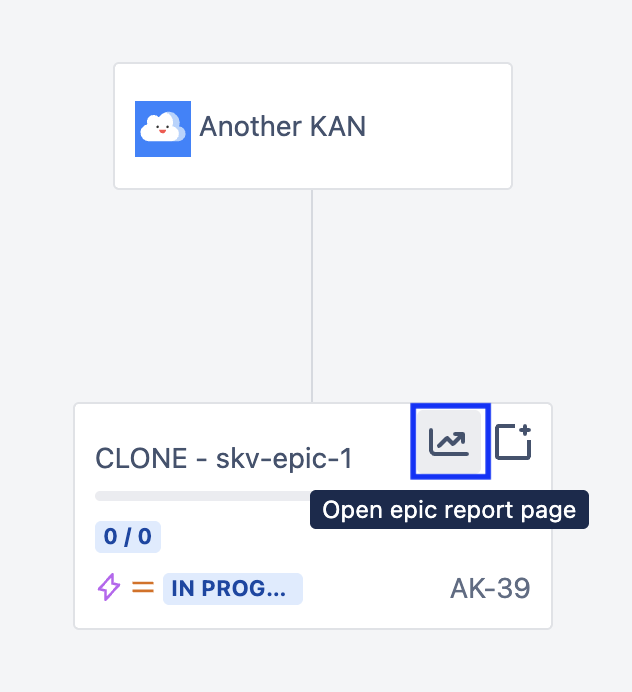
The Graph view also allows you to instantly navigate to the Jira Epic Report page:
To go to the Jira Epic Report page:
Hover over the Epic in Graph view.
Click on the Report icon.
Security
No data stored outside of Jira.